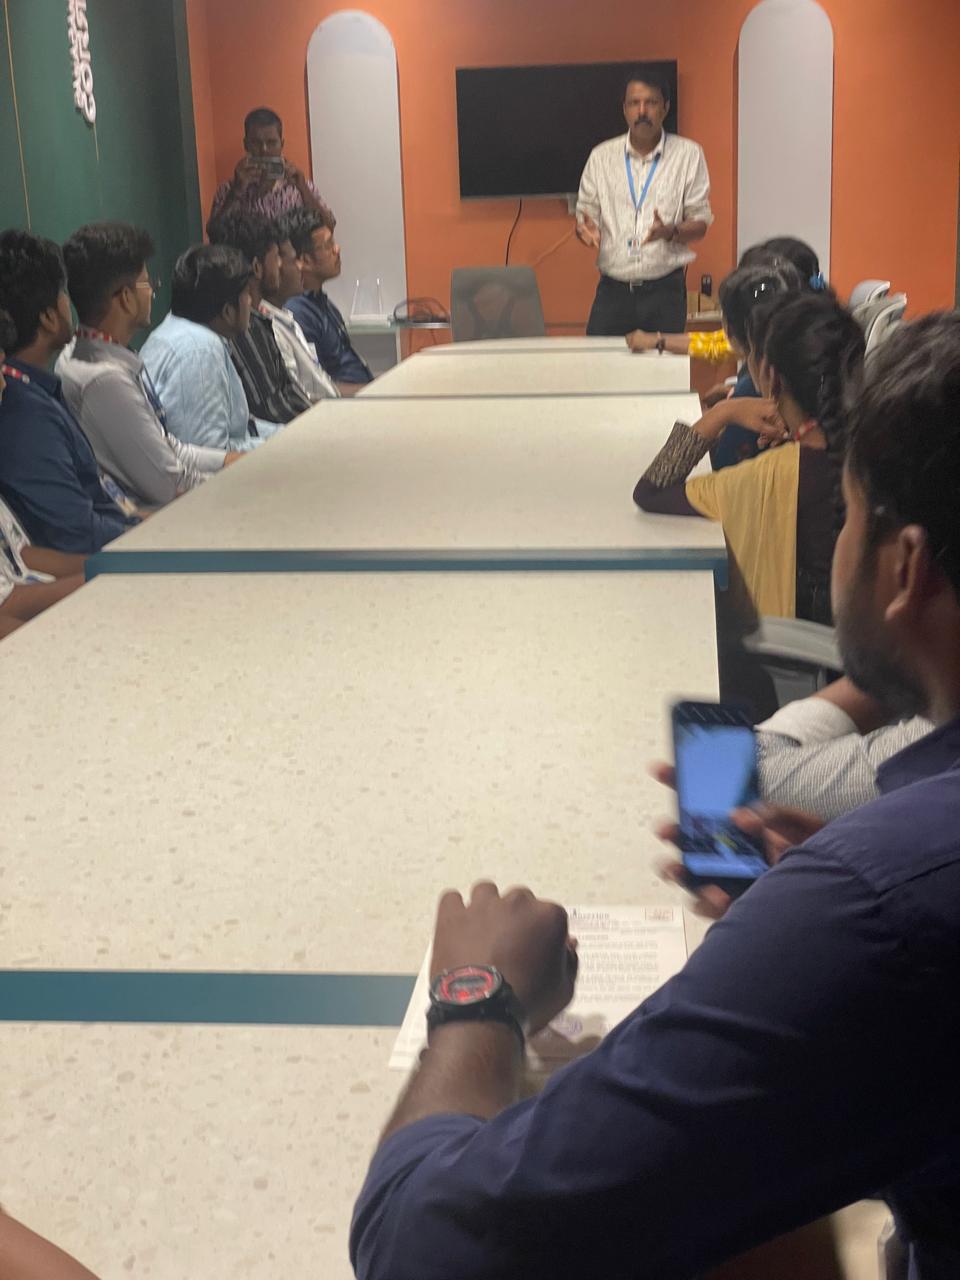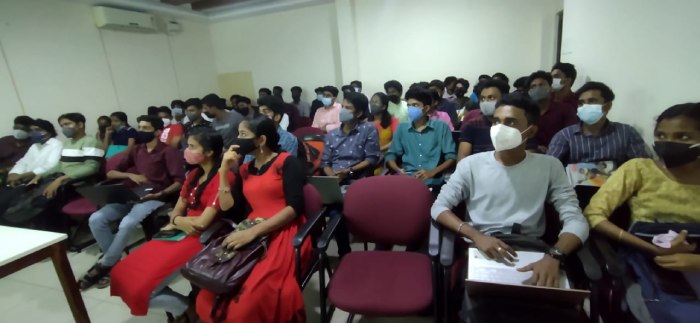

Tableau Training by Experts
Our Training Process

Tableau - Syllabus, Fees & Duration
Module 1 - What Is Data Visualization?
- Why Visualization came into Picture?
- Importance of Visualizing Data
- Poor Visualizations Vs. Perfect Visualizations
- Principles of Visualizations
- Tufte’s Graphical Integrity Rule
- Tufte’s Principles for Analytical Design
- Visual Rhetoric
- Goal of Data Visualization
Module 2 - Tableau – Data Visualization Tool
- What is Tableau? Different Products and their functioning
- Architecture Of Tableau
- Pivot Tables
- Split Tables
- Hiding
- Rename and Aliases
Module 3 - Tableau User Interface
- Understanding about Data Types and Visual Cues
Module 4 - Basic Chart Types
- Text Tables, Highlight Tables, Heat Map
- Pie Chart, Tree Chart
- Bar Charts, Circle Charts
Module 5 - Intermediate Chart
- Time Series Charts
- Time Series Hands-On
- Dual Lines
- Dual Combination
Module 6 - Advanced Charts
Module 7 - Maps In Tableau
- Types of Maps in Tableau
- Polygon Maps
- Connecting with WMS Server
- Custom Geo coding
Module 8 - Adding Background Image
Module 9 - Data Connectivity In-Depth Understanding
Module 10 - Creating Calculated Fields
Module 11 - Responsive Tool Tips
- Dashboards
Module 12 - Connecting Tableau With Tableau Server
Module 13 - Connecting Tableau With R
This syllabus is not final and can be customized as per needs/updates
- Since 2001, Making IT Experts by Experts
- Duration: 60 Hours (Vary as per your skill)
- Course Fees
- Individual Live Classes (1:1)
- Batch Classes @ Low Fees
- Training on Your Time, Any Where
- Access to Recorded Videos
- Practical Internship on Projects
- 100% Placement Support by our jobsNEAR.in
- Training/Internship Certificate
- Web Development Courses in Cochin
- Mobile App Develpment Courses in Cochin
- Website Design Courses in Cochin
- Networking and Security Courses in Cochin
- Digital Marketing (SEO) Courses in Cochin
- Graphics Training Courses in Cochin
- Cloud Computing Courses in Cochin
- Mean Stack Development Courses in Cochin
- Python Full Packages Courses in Cochin
- Animation & Video Editing Courses in Cochin
- Mern Stack Development Courses in Cochin
Course Highlights

Featured Courses

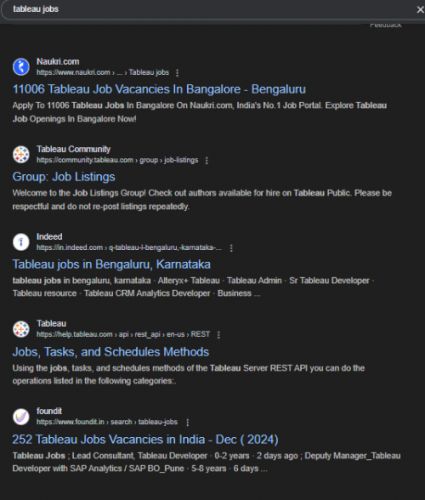
 . When hiring professionals, companies nowadays search for tableau knowledge. Most data analytics specialists now consider it a required skill. After developing a stable platform, this course covers all of Tableau's fundamentals. you learn about job possibilities that no one else would know about if you have a lot of industry connections. Tableau is one of the most popular data visualization solutions for data science and business intelligence requirements. Nestsoft is one of the best of them. This is why Tableau certifications have become incredibly popular. You can learn how to use Tableau on a number of different platforms. As a company data analyst, you would master the ability to communicate practical consequences, which this course will help you do.